Map Data
Location-Based Insight
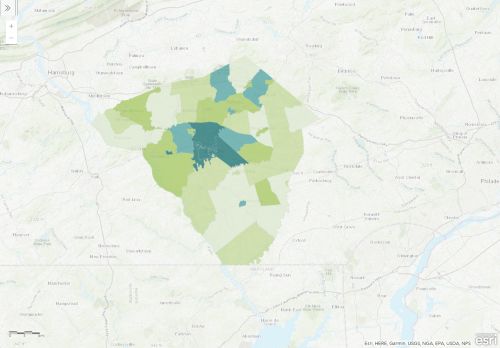
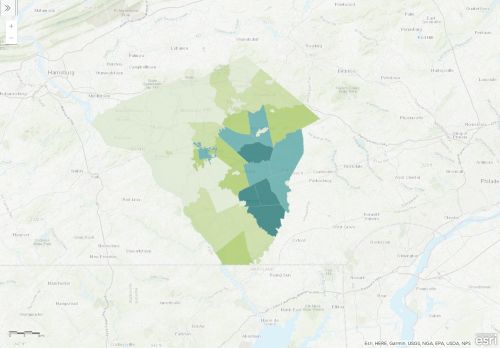
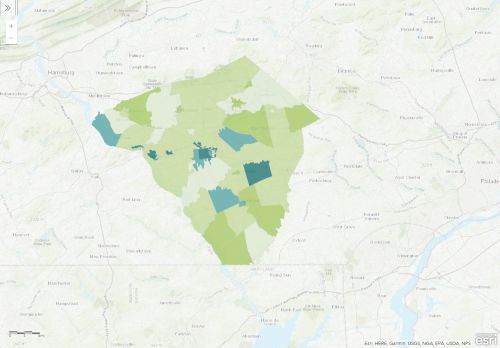
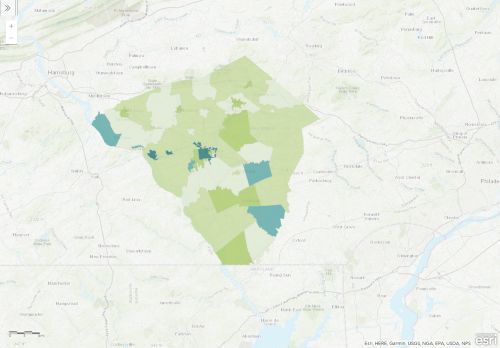
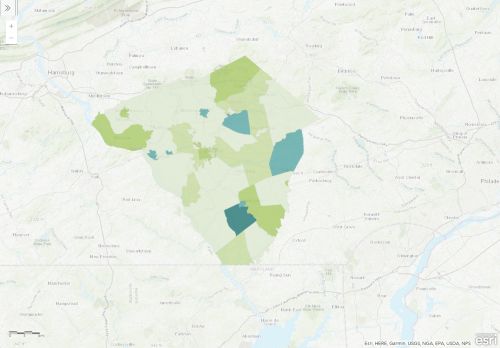
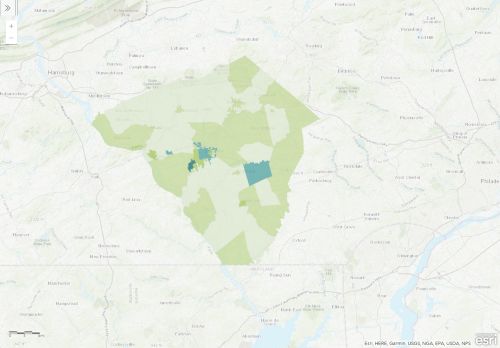
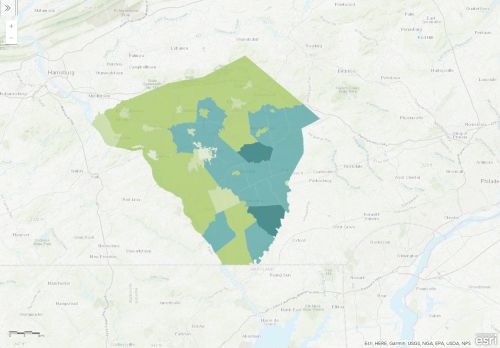
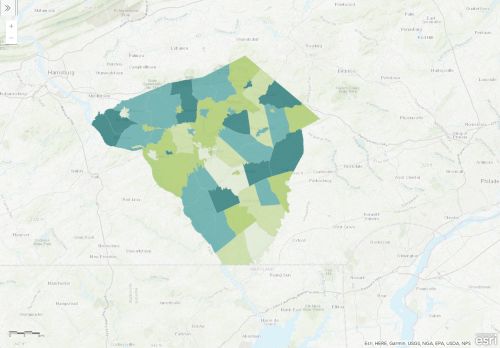
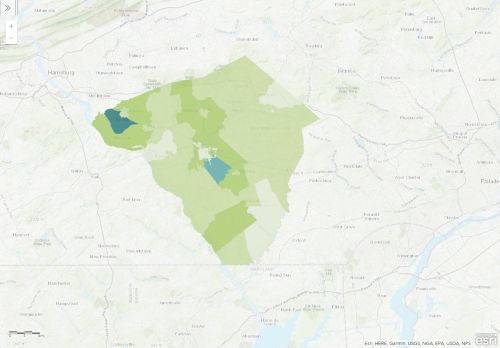
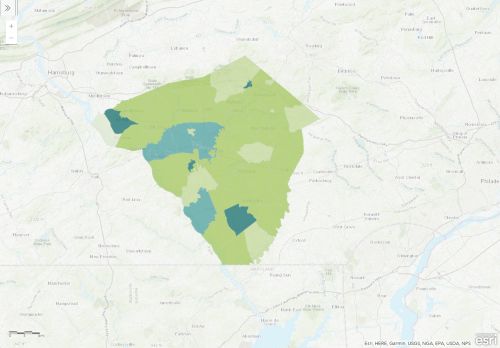
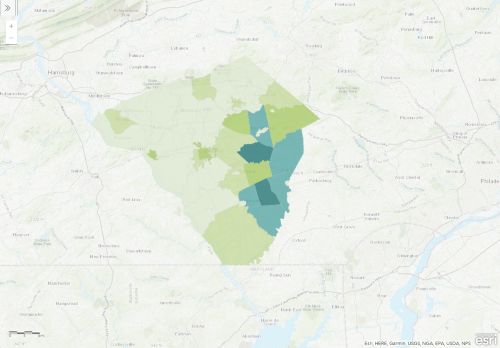
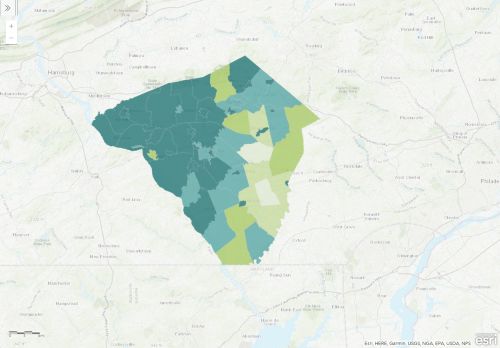
The maps below provide visualizations of a variety of indicator data, showing how they impact Lancaster County in different ways. These maps provide Lancaster County area data but get more interesting as you zoom in to view the data at the census-tract level. Here, we can see how indicators such as poverty and income vary tremendously within our county.
Children and Education

Disengaged Youth
The percentage of the population between ages 16 and 19 that is not enrolled in school and not working (either unemployed or not in the labor force).

VIEW MAP

Demographics

People with Disabilities
The percentage of the people living with a disability, out of all people not living in institutions.

VIEW MAP

Foreign-Born Population
The percentage of the population in a region that is foreign-born, which includes anyone who is not a U.S. citizen at birth. People who become U.S. citizens through naturalization are considered foreign-born.

VIEW MAP

Language Diversity
The share of people 5 and older in a geographic area who speak a language other than English at home. This includes both people who speak English well and those who do not.

VIEW MAP

Financial Security

Children Living in Poverty
The number of children under 18 who live below the federally defined poverty line, expressed as a percentage of all children under 18. Poverty thresholds vary by family composition and year. In 2022, the threshold for a four-person family with two children was $29,678.

VIEW MAP

People Living in Poverty
The share of residents with incomes below the federal poverty level. Poverty thresholds vary by family composition and year. In 2022, the threshold for a four-person family with two children was $29,678.

VIEW MAP

Veterans Living in Poverty
The estimated proportion of veterans with incomes below the poverty line. Poverty thresholds vary by family composition and year. In 2022, the threshold for one person was $14,880.

VIEW MAP

Working Poor
The number of employed individuals whose incomes fall below the poverty line. Poverty thresholds vary by family composition and year. In 2022, the threshold for a four-person family with two children was $29,678.

VIEW MAP

Median Home Value
The home value reported by the homeowner to the Census Bureau, adjusted for inflation to 2022 dollars. The median represents the mid-point of home values (half the values are above the median and half below).

VIEW MAP

Occupied Housing Units
The percentage of residential housing units that are occupied or not vacant.

VIEW MAP

Median Rent
The most recent monthly rent plus the average monthly payments for utilities and fuel, as reported to the Census Bureau, adjusted for inflation. The median represents the mid-point of monthly rents (half the values are above the median and half below).

VIEW MAP

Cost of Renting
The proportion of household income that goes toward monthly rent, utilities and fuel, calculated by dividing median rent by median household income for renters.

VIEW MAP

Households Without Vehicles
The number of households that do not report having a vehicle kept at the home and available for use, expressed as a percentage of all households.

VIEW MAP

Technology

Households With Internet Access
The percentage of households that have access to the Internet.

VIEW MAP


Loading...